Common Passive Multifamily Real Estate Investing Terms Explained: IRR, ROI, AAR, COC
I felt compelled to use this article to explain various terms that are thrown at passive investors. Recently, a seasoned investor asked me about the difference between Average Annualized Return (AAR) and Internal Rate of Return (IRR). Navigating all these numbers and knowing exactly what you are investing in can be challenging as a passive investor. This article will help you understand what numbers to look at when trying to make an apartment investment decision.
In order to compare apples to apples, the same scenario will be used throughout the article.
Scenario
We bought apartment building “A” in January 2018 for $5 Million and sold it in January 2020 for $8 Million. We created $105,000 cash flow during the first year of holding and $135,000 cash flow during the second year of holding. We put $1.5 Million as a down payment, all fees included. The loan amount was $3.5 Million. During the holding period, we invested $1 Million into capital improvements. For simplicity, let’s assume that the fees totaled $150,000 to sell the property.
Return On Investment (ROI)
Return On Investment, also known as Total Return or Return On Cost, is a ratio between net income/loss and investment.
The Math
ROI = Total Profit (Profit To Date) / Cost of Investment
Sample Calculation
ROI = $2,090,000 / ($1,500,000 + $1,000,000) = 83.6%
Pros
ROI is easy to understand. It’s a quick, “back of the napkin” calculation to assist the investment profitability.
You can use ROI to compare different types of investments.
You can take a snapshot of ROI the moment for a “To Date ROI” before the project completes.
Cons
This formula does not account for time. Using the above example, someone can yield a profit of 84.53% in 2 years or 20 years. While it is a phenomenal return for 2 years, it is a shabby return for a 20 year holding period. We will explain more in the following section.
What is a “good” ROI for a multifamily syndication?
When using ROI to evaluate a good investment for passive returns in a multifamily syndication, one has to ask another question - “What is the holding period?” So these should always be communicated with holding periods. At the time of this writing, a conservatively projected “good” return should be at or above 70% ROI to investors during a holding period of five years or less. If the projected return on investment is above 120%, investors need to look at the underlying assumptions for this high of a projection. Are they overly optimistic? Always invest with teams of operators or projects that value the “under-promise and over-deliver” philosophy.
Projects that have lower risks usually provide less returns. Thus, new construction or heavy value-add projects (No, we are not talking about just your typical interior updates and adding dog parks.) should yield investors a higher return in comparison with a multifamily project in a fantastic location needing a small face lift.
Average Annualized Return (AAR)
Average Annualized Return simply takes the total ROI and divides it by the years of investment to measure average returns on an annual basis.
The Math
AAR = Total Profit (or Profit to Date) / Cost of Investment / Years of Holding
Or, simply put:
AAR = ROI / Years of Holding
Sample Calculation
Using the same ROI calculated above at 83.6%
AAR = 83.6% / 2 = 41.8%
Pros
AAR is a relatively simple formula for understanding the average annual income of an investment.
AAR can be compared between different investment types.
AAR includes equity gains as well as cash flow gains.
This formula accounts for the holding period when the total return is the same. For example, 100% total return in two years has a different value than in five years.
Cons
The AAR formula does not account for time and opportunity cost. We all know a dollar today is not the same as a dollar tomorrow. AAR merely gives you an average number as if a dollar today is the same as a dollar tomorrow.
The AAR formula does not give any indication to how efficient a dollar is being used. For example, an investment return of 100% in five years is the same as 140% in seven years. However, in terms of opportunity cost, the investment that returns in five years is slightly better than the investment that returns in seven years.
The AAR number gives no clue to gain from equity or cashflow component.
What is a “good” AAR for a multifamily syndication?
This measure varies widely in multifamily syndications. I personally do not focus on this measure when evaluating my investment returns. I use Internal Rate of Return, IRR, instead. However, if one needs to take this as a measure, I would suggest that the higher the degree of value-add (risk) involved, the higher the AAR should be. At the time of this writing, 14% or more is a good number for AAR for a stabilized property needing cosmetic upgrades. 16% or more is a good number for heavier value-add. New construction should be above 18% due to the amount of risk and lack of cash flow.
Cash On Cash Return (COC)
According to Investopedia, this is the same definition as AAR. However, I would like to make a distinction between the two when it comes to multifamily syndications. I see these being used in investor materials from the industry differently compared to the Investopedia definition.
Cash On Cash Return measures the annual return the investor makes on a property in relation to the amount of operation expenses and mortgage payments made during the same year. There are a couple ways that Cash On Cash returns are being defined. In multifamily syndications, this means annual cash return to investors. This form of annual cash returns are usually distributed quarterly or monthly.
The Math
Sample Calculation
Let’s use the same scenario from above. In this calculation, we will only be looking at cashflow.
Here are our initial investments.
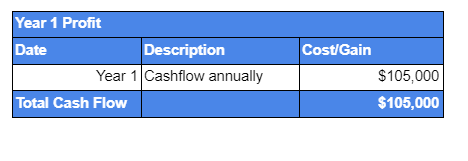
Here is our cash flow summary.
COC = ($240,000 / 2 years) / $2,500,000 = 4.8%
Pros
COC is relatively easy to understand.
For investors who want to focus on cashflow, COC is a great measure to understand if an investment fits your financial needs and goals.
COC can be used to compare different types of cashflow investments.
COC can be a financial snapshot before the project completes to give a “To Date” cash on cash return.
Cons
The COC formula does not account for time. Though it gives a better indication of how the investment is doing over time, as you can take a snapshot of each year and show the cashflow amount per year, it does not include opportunity cost and inflation impact. Using the above example, someone can yield a profit of 84.53% in five years. However, if he or she made more money in the first year versus in later years, that is better for the investor, accounting for inflation. This cash on cash return formula cannot tell the difference of that in value.
COC does not account for equity increase in multifamily syndications. Although, strictly speaking, the original definition of COC includes the equity element, when used in syndication investor materials, they often mean average annual cashflow to investors without counting equity. It focuses on a single dimension of investment - Cashflow.
What is a “good” COC return for a multifamily syndication?
At the time of this writing, a conservatively projected “good” return for apartment syndication should be around 7% annually for a hot secondary market such as Dallas, TX or Phoenix, AZ. We will see this number decrease as the market becomes hotter and increase as the market becomes cooler. When investing in a tertiary market, one should look for 8% or better annual return. In tier 1 markets, such as New York and San Francisco, this number decreases dramatically to 5% or less. In fact, in some of these markets, assets rarely cashflow. The play becomes purely based on equity.
Internal Rate of Return (IRR)
This is my favorite measure when used to examine an investment. IRR takes inflation, time and opportunity cost into account. This formula is a bit hard to understand. Don’t worry too much about math, that is what the excel formulas are for. Let us instead focus on the essence of the math. IRR essentially takes inflation and time of holding into account to bring future dollars into the present day. It attempts to use the initial investment as a baseline and measures all profit in current day dollars. In a stabilized economy with a constant inflation of 2%, you simply see that most AAR is 2% higher than IRR has projected. However, we all know that is not the truth. Thus, given a longer period of holding, the IRR decreases and the corresponding AAR stays the same.
The Math
Where NPV (Net Present Value) should equal to 0. This is hard to derive as you try to balance the IRR so that it results in NPV that is net zero.
Sample Calculation
If we have to do this by hand, here is how we do it.
To keep our example simple, we will assume the following:
The period is in years
The capital improvement fund is invested in years up front.
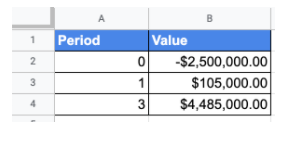
CF0 = Initial Investment + Capital Improvements = $2,500,000
CF1 = $105,000
CF2 = $135,000 - $150,000 + $4,500,000 = $4,485,000
IRR = 36%
The good thing is that you can just use the Excel formula to do the calculations as seen below.
Pros
The biggest advantage of IRR is that it accounts for time value and opportunity loss in the form of inflation. It allows one to truly compare apples to apples in today’s dollar value and helps investors make more informed decisions.
IRR can be compared amongst different investment types.
It takes into account equity gain as well as cashflow gain.
Cons
IRR can be hard to calculate without specialized calculators and excel formulas.
It is hard to separate equity gain vs. cashflow gain in this formula.
What is a “good” IRR for a multifamily syndication?
At the time of this writing, for a low stabilized multifamily syndication project with a cosmetic value-add play, 13%-14% is a good IRR when conservatively projected. With heavier value-add, 15% or higher is a “good” return. 16% or higher should be the measure for new construction.
We’ve created a simple, free online IRR calculator if you have an investment you want to try comparing the IRR and AAR calculations for.
Conclusion
At the end of the day, numbers are just numbers when it comes to multifamily syndication investments or any type of investments when you are not in the driver’s seat. One has to peel back the layers to understand the basic underlying assumptions. It is important to have a basic understanding and ask questions on how the numbers are delivered when making decisions to invest passively.
For example, if you see a stable deal with minor value-add elements having more than 20% IRR, your investor alarm should go off. Use a good Chinese proverb - there are no free meat buns falling from the sky - these projections likely are too aggressive. I personally like to invest with folks who value “under-promise and over-deliver.” Vetting your sponsors and the value they hold should be a significant part of your process.
If you’re ready to take your investment education to the next level and ready to start your journey as a passive investor, we would love to talk with you today.


